What is Monitoring
Systems Monitoring means you are continuously getting metrics from your system. Monitoring can be done by having someone gathering and checking a given set of metrics on your system or, the way or support, by having a centralized system that gathers these metrics by running checks on target systems and acting when the results are outside the defined parameters.
Monitoring with metrics
You can monitor via metrics which can give you an instant and quantitative picture of how your systems are behaving. This is much clearer with some real metrics examples:
- CPU usage
- Memory usage
- Disk free space
- In/Out network traffic
These are just some metrics you can collect from your servers which will help you make better decisions and understand systems’ behavior better than before.
You can also collect middleware and application level metrics that will increase your ability to understand your applications behavior and better react to problems. Some examples are:
- Gather metrics from the JVM if you are running a JAVA application such as:
- heap size
- time spent on garbage collection
- number of threads
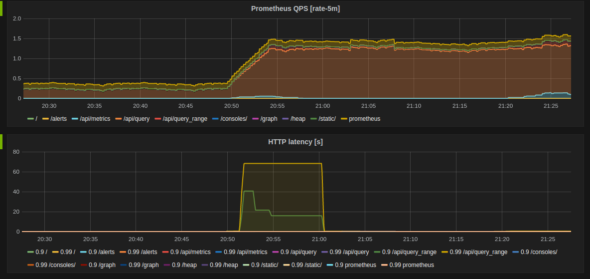
- Collect Elapsed time on HTTP requests
- Insert timers on specific functions on your code and return the values for collection
There are several systems who will allow you to collect and store metrics so they become useful long past the moment they are created. Some examples are:
- Prometheus
- Nagios
- Zabbix
- Datadog
- Microsoft SCOM
Without these tools your metrics became much less efective because you lose the ability to look back in time at points where you want to understand what happened, during a systems slowdown event, for instance.
Monitoring with logs
You can, and you should, also monitor your systems using logs for specific events. You can do aggregation over the logs and create metrics out of the log aggregations.
Lets go over some examples to make sure this is clear:
- 500 HTTP errors per minute – from logs on your web server
- Logins per hour from logs on your service
Monitoring with logs can improve observability of your software even if you are running a closed source software and can’t get metrics out of it.
What is Alerting
Now you are monitoring your system you have several measurable interfaces with your system’s health. When all these numbers run through a monitoring system you are able to define rules to alert or act on these systems based on the parameters you establish.
Some examples of alerts:
- You monitor your Filesystem’s free space:
- Drops bellow 20% on your database server – maybe this isn’t that worrying because so just create a ticket
- Drops bellow 5% on your database server – this probably spells trouble in a short amount of time so maybe call someone’s phone
- You monitor your JAVA application’s Heap size:
- Goes over 1GB – Restart the service
- You monitor your database server:
- database service stops – Call someone
How do I start monitoring?
Start simple with something out of the box and work your way up the chain into something like application native metrics where your application enables a monitoring system to collect runtime metrics like the elapsed time for a specific function.

