3 Easy Steps to Lower Your Cloud Bill With Automation

Cloud computing has revolutionized how businesses operate, offering incredible scalability, flexibility, and accessibility. However, the costs can quickly stack up if not managed appropriately. Today, we’re going to share three simple steps to cut down your cloud expenses, and the secret ingredient here is automation.

1. Identify and Eliminate Waste through Infrastructure as Code (IaC)

First and foremost, identifying waste is crucial in reducing your cloud expenses. This involves a thorough understanding of your resources, their usage, and the ability to track any inefficiencies.

Infrastructure as Code (IaC) is a game-changer in this regard. IaC tools, such as Terraform and CloudFormation, allow you to programmatically manage and provision your cloud infrastructure. Instead of manually setting up and configuring resources, you write code that automates these processes. This not only makes your infrastructure setup more efficient and repeatable, but it also offers several advantages in identifying and eliminating waste:

Efficient Tracking and Management

IaC tools can help you keep track of all your resources, providing a centralized view of your cloud environment. You can use these tools to define your infrastructure requirements, monitor their usage, and detect any instances of over-provisioning or under-utilization. If a resource is idle or not performing as expected, it’s easy to identify and address.

Consistency and Standardization

With IaC, you can maintain consistency and standardization across your infrastructure. It ensures that every resource is configured in the most efficient manner, adhering to your defined parameters, reducing the risk of incurring unnecessary costs due to inconsistencies or misconfigurations.

Resource Optimization

IaC tools allow you to use templates or modules to create and manage resources. You can design these templates to adhere to best practices for cost optimization, ensuring that every new resource provisioned is as cost-effective as possible.

Simplified Infrastructure Changes

With IaC, making changes to your infrastructure is as simple as updating your code. This means you can quickly scale down resources or decommission them altogether when they’re not in use, helping to avoid the cost of unused resources.

Automation

The principle of IaC aligns perfectly with automation. You can use these tools in combination with continuous integration/continuous deployment (CI/CD) pipelines to automate the creation, management, and decommissioning of resources, ensuring you’re always using (and paying for) only what you need.

Action Steps:

  • Implement Infrastructure as Code practices using tools such as Terraform, or CloudFormation.
  • Regularly review your infrastructure code to identify and remove any unused resources.
  • Automate infrastructure updates through a CI/CD pipeline to ensure optimal usage and prevent waste.
  • Use IaC tools to standardize and optimize your resource provisioning, eliminating the risk of over-provisioning and under-utilization.
  • Include alerts to notify you of sudden cost increases or underutilized resources in your IaC.

2. Leverage Autoscaling

One of the key benefits of cloud computing is its scalability. But if you’re manually scaling your resources up and down based on demand, you’re not fully harnessing this power.

Autoscaling, a feature offered by most cloud providers, can help you automatically adjust resources based on the real-time needs of your applications. It eliminates the need for guesswork, reduces waste, and can significantly cut down your cloud bill.

Action Steps:

  • Implement autoscaling for your cloud applications. Make sure to properly configure the scaling policies to avoid unnecessary costs.
  • Monitor your autoscaling activities regularly to ensure they’re working as expected.

3. Optimize Your Storage

Storage can be a significant portion of your cloud bill. Most cloud providers offer several storage types, each with its own cost structure. Using the right type of storage for each task can help you optimize costs.

For example, storing infrequently accessed data in hot storage can be a wasteful practice. Instead, you can automate the process of moving this data to cold storage, which is much cheaper.

Action Steps:

  • Review your data access patterns and automate data lifecycle management. Use tools provided by your cloud provider or third-party solutions.
  • Regularly check for orphaned or unused data and automate its deletion.

Conclusion

Cutting down your cloud bill goes beyond mere cost-saving; it’s about optimizing your resources and implementing efficient practices. As we’ve highlighted, these processes can be straightforward, but they require continuous monitoring and hands-on management, which can quickly become overwhelming. This is where the true power of automation and Infrastructure as Code (IaC) shines.

By employing automation, you save invaluable time, increase operational efficiency, and minimize human error. Incorporating IaC allows you to programmatically control your cloud infrastructure, bringing about an enhanced level of standardization, consistency, and efficiency. Not only does this enable you to identify and eliminate waste, but it also allows for strategic, data-driven decision-making about your cloud usage.

The journey to cost optimization in the cloud is unique for each organization. It involves constantly assessing your practices and adjusting where necessary. With automation and IaC, you’re better equipped to take control of this journey, making a significant impact on your cloud bills and your budget.

How Reducing ‘commit-to-production’ time Enhances Developer Experience

Exoawk

Lead time for changes is defined by the time it takes a commit to get into production in DORA metrics. From a developer experience perspective, we are talking about how efficient and intuitive the process is and how comfortable developers are with the tools, processes, and workflows throughout the entire software development lifecycle.

Lead time can provide valuable insights into the developer experience in different ways.

When we examine lead time from a developer experience perspective, we’re essentially analyzing the efficiency, intuitiveness, and ease of use of the tools, processes, and workflows that a developer interacts with throughout the software development lifecycle.

  1. Workflow Efficiency: A shorter lead time generally indicates that the workflows developers are following are efficient. It suggests that there’s a high level of automation in place, reducing the need for time-consuming manual tasks. This allows developers to focus more on coding and problem-solving, which is what they are primarily interested in and where they add the most value.
  2. Tool Usability: The speed from commit to production can also reflect the usability of the tools developers are working with. Tools that are intuitive and easy to use can significantly speed up the software development process. Conversely, complex tools with a steep learning curve can slow things down and lead to frustration. An example of this dichotomy in CI/CD- Jenkins and Gitlab – while Jenkins is widely used and automates various phases of software delivery it is also criticized for its complex setup process, outdated user interface, and steep learning curve, which can hinder developer productivity and satisfaction. Gitlab, on the other hand, a more modern CI/CD tool, provides a more streamlined and intuitive user experience. The workflow configuration is as simple as adding a YAML file in your repository, and it integrates natively with the Gitlab platform that developers are already using for their code. This can simplify the process of setting up automated build, test, and deployment pipelines, thus reducing the lead time.
  3. Collaboration and Communication: Effective DevOps practices require close collaboration and communication between developers, operations teams, and other stakeholders. A shorter lead time can indicate that developers are communicating well with their colleagues, issues are being addressed promptly, and there’s a culture of shared responsibility, all of which contribute to a positive developer experience.
  4. Feedback Loop: The sooner developers can see their code running in a production environment, the faster they can get feedback on their work. This not only improves the quality of the software but also contributes to a sense of achievement and motivation. Developers can learn from mistakes, improve their skills, and see the direct impact of their work.
  5. Problem Solving: A shorter lead time means that issues are detected and solved quicker. This reduces the time developers spend debugging and resolving problems, improving their overall experience.
  6. Learning and Growth: Rapid lead time cycles can promote a culture of continuous learning and improvement. Developers can experiment, take risks, and innovate, knowing that they can quickly correct any issues that arise.

However, while lead time is a useful metric for assessing the developer experience, it’s important to consider other aspects as well. Developers’ satisfaction with their work environment, the quality of documentation and support, the level of autonomy they have, and the opportunities for learning and professional growth they receive are all critical components of the developer experience.

In summary, lead time is a powerful metric that, when used in conjunction with other measures and qualitative feedback, can provide a comprehensive view of the developer experience within a DevOps context. By focusing on improving this metric, organizations can create a more positive, productive, and satisfying experience for their developers, ultimately leading to better software and happier customers.

Unleashing Operational Efficiency: How Terraform Empowers Small and Medium Companies

Exoawk

In the dynamic world of digital business, small and medium companies or startups can often find themselves scrambling to manage and configure their IT infrastructure. As these companies rapidly scale, they need robust, scalable, and flexible infrastructure management solutions. Enter Terraform – a popular Infrastructure as Code (IaC) tool that can help businesses automate their infrastructure setup, thereby enhancing operational efficiency and results.

The Terraform Advantage

At its core, Terraform is an open-source tool developed by HashiCorp that enables businesses to define and provide infrastructure using a high-level configuration language. It supports a wide variety of cloud service providers such as AWS, Google Cloud, Azure, and many more as well as others, commonly associated with on-premise infrastructure. With Terraform, infrastructure is managed as code, which means it can be versioned, shared, and reused, just like any other software code. This method provides several key advantages.

Simplifying Infrastructure Management

Traditionally, infrastructure management has been a manual and tedious process. However, with Terraform, you can create a template for your infrastructure, which can then be reused and replicated effortlessly. This not only saves significant time but also reduces the risk of human errors that can occur during manual configurations.

Terraform introduces the concept of modules, which are containers for multiple resources that are used together. Modules further simplify infrastructure management by encapsulating reusable code into logical, manageable units. A module can define reusable infrastructure components, like a database cluster or a network topology, as code. This code can then be called upon whenever that particular infrastructure component is needed, further reducing duplication and maintaining consistency across environments.

A key benefit of using Terraform modules is that they are shareable. Organizations can develop a library of modules that capture their common infrastructure patterns. These modules can then be shared across teams, promoting code reuse and reducing the time needed to safely provision new infrastructure.

Modules also provide a way to handle complex dependencies. By grouping related resources together in a module, you can manage dependencies between them more effectively. This can help ensure resources are created and destroyed in the correct order, reducing potential errors and making it easier to manage complex environments.

Through these features, Terraform modules bring a new level of simplicity and efficiency to infrastructure management. They reduce complexity, increase reusability, and enhance the maintainability of your infrastructure code, making Terraform an even more powerful tool for businesses looking to optimize their operations.

Scalability and Consistency

As startups and small businesses grow, their infrastructure needs to scale accordingly. Terraform helps in this regard by providing a consistent approach to provision and manage any size of infrastructure. No matter how large your infrastructure grows, the configuration files, or ‘Terraform files,’ remain simple and readable. This scalability ensures your team can handle growth without getting overwhelmed by infrastructure management.

Cost Efficiency

Cost control is a critical concern for small and medium-sized businesses. Terraform offers cost benefits by automating infrastructure management, reducing the need for dedicated personnel to handle these tasks. By minimizing human intervention, businesses can lower their operational costs and direct their resources towards other strategic areas.

Enhanced Collaboration and Productivity

With Terraform, infrastructure changes become traceable and transparent, improving collaboration among team members. Terraform configuration files can be version-controlled and shared among the team, enhancing collaboration and reducing misunderstandings and conflicts. This visibility into infrastructure changes can significantly increase productivity.

Boosting Security and Compliance with Terraform

In a world where security breaches and compliance failures can have severe consequences, managing the security of IT infrastructure is crucial. Terraform brings significant benefits in this area, thanks to its ability to enforce consistent infrastructure policies and its integration with security-focused tools.

Enforcing Consistent Policies

With Terraform, you can codify security and compliance policies into your infrastructure setup. This practice ensures that every piece of infrastructure provisioned adheres to your organization’s security standards. Terraform allows you to define these policies as code, ensuring they’re consistently applied across all your environments.

Terraform’s support for modules also plays a vital role in security. You can build security controls into your modules, ensuring that every piece of infrastructure created using those modules complies with your security policies. This approach reduces the risk of human error leading to security vulnerabilities.

Reducing Vendor Lock-in

One of Terraform’s most significant benefits is its provider-agnostic nature. It supports a multitude of platforms, thereby reducing the risk of vendor lock-in. This means businesses have the freedom to choose their service providers based on their specific needs and can switch providers without having to change their entire infrastructure setup.

Integration with DevOps Practices

Terraform integrates seamlessly with DevOps practices, promoting the rapid development, testing, and release of software. With the IaC approach, infrastructure changes can be applied alongside application code changes, ensuring faster and more reliable deployments.

Conclusion

Terraform presents a powerful solution for small to medium-sized businesses looking to boost their operational efficiency. By automating and simplifying infrastructure management, promoting scalability, enhancing collaboration, reducing costs, and supporting DevOps practices, Terraform allows these companies to focus more on their core business offerings and less on their infrastructure.

If you’re looking to streamline your operations, enhance productivity, and prepare your business for growth, it might be time to explore what Terraform can offer. With its wide range of features and benefits, this tool could be the catalyst that propels your business to the next level of success.

Exoawk understands the challenges faced by small and medium businesses, especially when it comes to IT infrastructure management. We recognize the need for robust, scalable, and efficient solutions – that’s where our expertise with Terraform comes in.

We provide comprehensive Terraform services designed to help your business automate its infrastructure setup, thereby enhancing operational efficiency, scalability, and security. Our team of experienced professionals will work closely with your business to understand its specific needs and tailor a Terraform solution that fits these requirements.

Whether you’re just starting with Infrastructure as Code or already have Terraform scripts that need optimization, we’re here to help. We can assist you in developing reusable Terraform modules, implementing effective security and compliance practices, integrating Terraform with your existing DevOps pipeline, and much more.

If you’re ready to unlock the potential of Terraform and revolutionize your operational efficiency, we’re here to help. Contact us today to explore how our Terraform services can propel your business to new heights of success.

Client showcase – From the ground up!

Architecture with load-balance

We like to share our thoughts and work so we can give back to the community a very small part of what we take from it every day.

On that spirit we decided to share a little bit on a project we’ve been working with a client on for some time now. The idea is to show some parts of what we’ve built for this client, the how, the why and the journey to get there. We hope this will inspire others to the the same and share their work so we can also learn from it.

Although we did get approval from our client to write about our story together we will not reveal it’s identity because we want to keep some level of discretion.


Some context first

This client is an established local company with international presence, several released products (both hardware devices and software) and a noticeable footprint on it’s target market. We started working with them on improving their infrastructure for the new phase of their company and some very exiting new products they will be releasing soon.

When they approached us they were looking to build a platform that could grant them some key features:

  • A good developer experience
  • Fast prototyping
  • Reliability
  • Elasticity
  • Scaling potential

Our client was already looking into containerizing their environments and so Kubernetes was a obvious option for their type of workload.

After we got to know them and talked about what they envisioned for the future we decided Kubernetes was a a good approach and started to get our hands dirty.


Ground work

We started by getting the team together and exploring some base concepts for Docker and Kubernetes so all the team would feel as comfortable as possible with this change going forward. This was actually a requirement from our client which just goes to show how thoughtful their plan was right from the beginning.

We did a boot camp with the team, going through some key Docker concepts and exercises before taking a look at Kubernetes and how this would help them going into the future.

After everyone was comfortable with these new technologies and how we would apply them we started to work on the actual infrastructure side of the project.

To run Kubernetes workloads you need a Kubernetes cluster so that is exactly what we did – we created a Kubernetes cluster. For this first phase we did not use the usual cloud provider managed cluster. We created our own cluster running in our client’s infrastructure.

To build this cluster we used a project called Kubespray. It is a great help in setting up a Kubernetes clusters. It covers a wide spectrum of use cases: you can dive deep into each config or just go with the defaults and it will work very well out of the box.

Our requirements for this phase were quite simple and straight forward – A Kubernetes cluster with horizontal pod auto scaling.

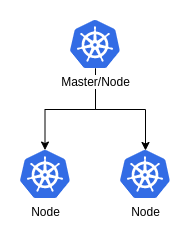
After this was done we had something like this:

Simple K8s setup
The Kubernetes setup

A couple of choices we took along the way:

  • We have only one master – Not ideal but sufficient for this use case
  • Our master is also a worker node – The cluster is not that big and the extra scheduling space is useful

We have a cluster, so the job must be done, right? Not really. There is no point in having a k8s cluster if you are not using it so: how are clients reaching it? 🤔

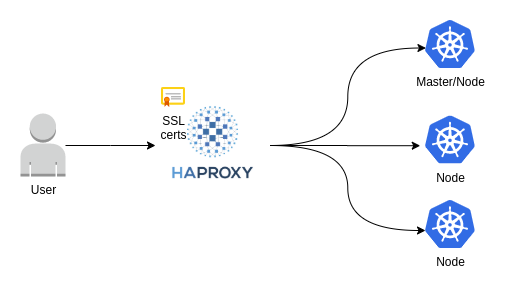
Because we don’t want to have one node get all the traffic and then potentially split it via the internal overlay network we need to have a way to split the traffic among the nodes. Enter HAProxy (you can learn a little bit more about HAProxy in our post about it – here).

We decided on HAProxy to be our point of entry due to it’s amazing feature set and incredible performance. We have also setup HAProxy such that it handles SSL termination for the environment, giving us a centralized location where to easily manage certificates.

We are not a company who likes to do things by hand over and over again so all of this is automated and managed by an Ansible playbook. This granted us the ability to rebuild our environment in a very short amount of time and in a consistent fashion. We know it because we did it already a couple of times.

We ended up with something like this:

Architecture with load-balance

To really get all the juice out of Kubernetes we took it to another level and decided to gather all the environments on the same cluster. This allowed our client to get an impressive speed from idea to test to production while keeping the runtime environment consistent across stages. We’ve leveraged Kubernetes namespaces to keep each environment contained and it is working very well.

Extra quests

After we had most of the ground work completed we started to think about how to tackle some other problems that were in need of improvement.

CI/CD

Our client was already using a tool by Microsoft called Azure DevOps. As we were forced to change the CI and CD part to bring it to new environment we were tasked with helping them bring their CI/CD infrastructure along.

For this, we created a new Ansible playbook to configure CI/CD agents for our client with a simple command. We were able to streamline the whole process and so, provisioning new agents is as simple as running a command.

Logs and Metrics

From the beginning of this new approach we knew we needed to do something about logging and metrics. We want to keep our logs and metrics after our pods are long gone (look here if you want to know more of our thoughts on monitoring) and we want to be able to alert on some metrics when they go out of regular parameters.

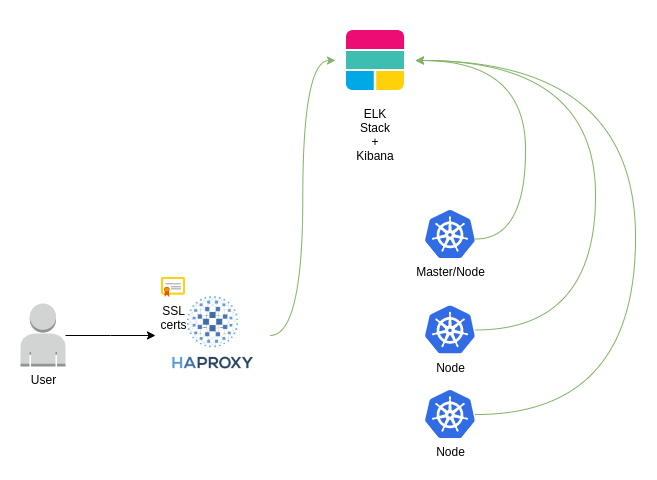
Our client was on board when we proposed ELK stack as way to tackle this need. Again, we opted to use another Ansible playbook to manage our ELK server deployment and we got into a state like this:

Log and metric shipping
Log and metrics (Green lines represent shipping)

This sets up our client with the ability to track, not only, the HTTP request that comes into HAProxy but also each and every log produced by their services divided by environment, service, pod, node and much more. One other cool feature our client gained is to know where the external traffic is coming from just by looking at a map!

This isn’t the end of our work this client, we keep cooperating and trying to achieve better and greater things as they become closer and closer to product launch.
A huge thank you to our client who was gracious enough to let us use them as a starting point for this series.

If you are dabbling with reliability and scaling issues and want some help reach out to: hello@exoawk.com we are always more than happy to do so!

Monitoring and alerting

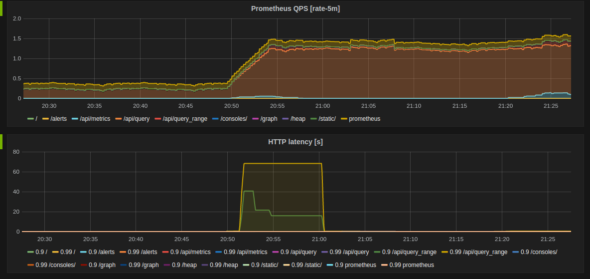
Monitoring dashboard example

What is Monitoring

Systems Monitoring means you are continuously getting metrics from your system. Monitoring can be done by having someone gathering and checking a given set of metrics on your system or, the way or support, by having a centralized system that gathers these metrics by running checks on target systems and acting when the results are outside the defined parameters.

Monitoring with metrics

You can monitor via metrics which can give you an instant and quantitative picture of how your systems are behaving. This is much clearer with some real metrics examples:

  • CPU usage
  • Memory usage
  • Disk free space
  • In/Out network traffic

These are just some metrics you can collect from your servers which will help you make better decisions and understand systems’ behavior better than before.

You can also collect middleware and application level metrics that will increase your ability to understand your applications behavior and better react to problems. Some examples are:

  • Gather metrics from the JVM if you are running a JAVA application such as:
    • heap size
    • time spent on garbage collection
    • number of threads
  • Collect Elapsed time on HTTP requests
  • Insert timers on specific functions on your code and return the values for collection

There are several systems who will allow you to collect and store metrics so they become useful long past the moment they are created. Some examples are:

  • Prometheus
  • Nagios
  • Zabbix
  • Datadog
  • Microsoft SCOM

Without these tools your metrics became much less efective because you lose the ability to look back in time at points where you want to understand what happened, during a systems slowdown event, for instance.


Monitoring with logs

You can, and you should, also monitor your systems using logs for specific events. You can do aggregation over the logs and create metrics out of the log aggregations.

Lets go over some examples to make sure this is clear:

  • 500 HTTP errors per minute – from logs on your web server
  • Logins per hour from logs on your service

Monitoring with logs can improve observability of your software even if you are running a closed source software and can’t get metrics out of it.


What is Alerting

Now you are monitoring your system you have several measurable interfaces with your system’s health. When all these numbers run through a monitoring system you are able to define rules to alert or act on these systems based on the parameters you establish.

Some examples of alerts:

  • You monitor your Filesystem’s free space:
    • Drops bellow 20% on your database server – maybe this isn’t that worrying because so just create a ticket
    • Drops bellow 5% on your database server – this probably spells trouble in a short amount of time so maybe call someone’s phone
  • You monitor your JAVA application’s Heap size:
    • Goes over 1GB – Restart the service
  • You monitor your database server:
    • database service stops – Call someone

How do I start monitoring?

Start simple with something out of the box and work your way up the chain into something like application native metrics where your application enables a monitoring system to collect runtime metrics like the elapsed time for a specific function.

If you are dabbling with reliability and scaling issues and want some help reach out to: hello@exoawk.com we are always more than happy to do so!

Use HAProxy to improve availability - A Simple introduction


HAProxy is an open-source project [http://www.haproxy.org/] that allows you to implement a high performance TCP/HTTP(S) load balancer without paying for dedicated hardware like F5, Cisco or Barracuda and the licences attached to it. HAProxy implements a very large feature set and is a very good fit for both low and high load scenarios where you want or need to implement high availability.


First things first – What is Load balancing?

Load balancing is a technique used to allow load distribution between several application servers.

This technique will allow you to spread the load of the application between multiple servers, thus, reducing reliance on a single server and improving performance. This brings multiple advantages, such as:

  • Performance – Spread the load between servers
  • Scaling horizontally and not vertically – Add more servers (more)
  • Reliability – By using two or more application servers
  • Serviceability – You can take servers down for patching without downtime

How does HAProxy work?

On a very high level, HAProxy acts as the entry point to your service [service is anything you need to load balance, like your web application]. This single entry point will be responsible for forwarding your traffic to the server(s) you declared to be responsible for serving that traffic. This is way easier to understand if you use an example so let’s jump right into it:

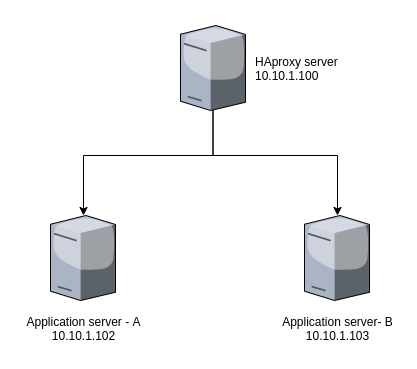
You have an HTTP application that returns the hostname of the server it is running on [dumb application but effective to show load-balancing]. Let’s see how this would look like:

Image 1 — A Very Simple HAProxy example

In this simple case [Image 1] we implement one HAProxy server as an entry point to our application servers. This means, if we want someone to reach our application, we need to provide them with the HAProxy server IP address.


Let’s look at how this looks like in terms of HAProxy config:

defaults
mode http
frontend main *:80
default_backend app
backend app
balance roundrobin
server appA 10.10.1.102:5000 check
server appB 10.10.1.103:5000 check

What this means:

First, lets define what a “frontend” and a “backend” are:

  • Frontend is an HAProxy concept to represent the entrypoints for HAProxy. A frontend defines the IP addresses and ports HAProxy listens for client traffic to forward to your application
  • Backends are the servers that serve your application: Nginx, Apache, IIS, Tomcat and so on.

Our config file implements the scenario we described above:

  • One entry point: a frontend, named main, that listens on all IP addresses, on port 80
  • One set of servers that can handle that traffic: a backend, named app, made of a couple of servers [appA and appB] which will be listening on their respective IP addresses, on port 5000. We are also stating we want to check that each server is able to get traffic — the ‘check’ entry

This will give us a “cool” app we can query using our HAProxy entry point, getting a response from each of the servers:

exoawk@pc-1: http 10.10.1.100
HTTP/1.0 200 OK
Connection: keep-alive
Content-Length: 8
Content-Type: text/html; charset=utf-8
Date: Mon, 13 Apr 2020 00:42:14 GMT
Server: Werkzeug/1.0.1 Python/2.7.5
Server B
exoawk@pc-1: http 10.10.1.100
HTTP/1.0 200 OK
Connection: keep-alive
Content-Length: 8
Content-Type: text/html; charset=utf-8
Date: Mon, 13 Apr 2020 00:43:25 GMT
Server: Werkzeug/1.0.1 Python/2.7.5
Server A

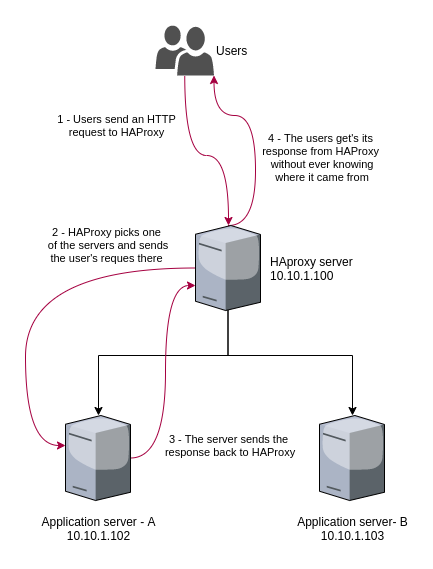
Here is what happened here:

Image 2- Step-by-step for the requests

This is just a very simple example but HAProxy is used in various, much more complex, scenarios. Here are a few examples:

  • You can setup HAProxy to redirect your visitor from HTTP to HTTPS — This has become more and more important as browsers are now marking HTTP traffic as unsafe
  • HAProxy can be used to balance requests across various servers using other strategies like hot/cold or least connection to help balance the load in other ways
  • TCP load-balancing is also easy to achieve with HAProxy so you can use it to sit in front of your email server or database servers with the right settings. Even for those who require a master/slave config

We will come back to this in the future to show how HAProxy can implement these, and other architectures. Stay tuned!


If you are dabbling with reliability and scaling issues and want some help reach out to: hello@exoawk.com we are always more than happy to do so!

Welcome!

This is Exoawk’s Blog!
We will be publishing mostly tech related content so stay tuned!